Method
The subject is the spreadsheet viewer the room portal ships, imported from its own source file rather than reimplemented for the test. The reference is LibreOffice 26.2.1.2 running headless. Both read the same four fixture workbooks.
The fixtures are four producer dialects, because the same visual result is written to disk four different ways depending on which program authored the file: openpyxl, LibreOffice Calc, a legacy .xls converted to .xlsx, and a hand-written spec-minimal ECMA-376 file that omits every optional attribute a parser might be relying on.
- FixtureOne .xlsx, four producer dialects
- Two rendersViewer in Chromium; LibreOffice headless to HTML and PDF
- ExtractComputed style per cell from both sides
- ScoreSix dimensions, plus a coarse pixel check
- GateBelow the committed baseline, the run exits 1
LibreOffice is converted twice. The HTML export is its interpretation: display strings, fills, bold and italic, alignment and merged ranges, with conditional formatting already evaluated into concrete background colours. The PDF export, rasterised at 150 DPI, is its rendering, used only for a coarse pixel comparison. The viewer side is extracted from the live DOM in headless Chromium at a 1440 by 1000 viewport, reading getComputedStyle on every td[data-cell-r]. Cells with zero width are skipped on both sides, because both have already dropped hidden rows and columns.
Six dimensions are scored, each as a pass count over a comparable count. Fill colours allow a tolerance of 8 per channel. Alignment compares only center and right, because LibreOffice stamps align="left" onto every default text cell including cells on right-to-left sheets, so a left match would be counting filler. Merges accept LibreOffice's column span both as written and net of columns its own export dropped.
Saudi number formats are the exception to using LibreOffice as truth. For Hijri dates and Arabic-Indic digits it is measurably wrong, so those cells are scored against a value computed from the specification with Intl.DateTimeFormat and Intl.NumberFormat. That divergence has its own article.
Reproducing it
The runner is tests/fidelity/run.mjs. It needs Bun, LibreOffice on the path as soffice, pdftoppm, and Playwright's Chromium. From a checkout:
node tests/fidelity/run.mjs --rebuild
node tests/fidelity/run.mjs --fixtures ksa-golden-openpyxl
Each run writes a timestamped JSON result and a PNG of the rendered grid, then compares every score against tests/fidelity/baseline.json. Any dimension below its committed floor prints the regression and exits 1, so a fidelity loss fails the build rather than shipping.
Results
Two different numbers matter here and they are easy to conflate. The run score is what one execution measured on one day. The committed floor is the gate underneath it, the level below which the build exits non-zero. A run that beats its floor is not a licence to quote the run as the guarantee, so both are below.
Run of 4 August 2026, four fixtures, 2,596 display-string comparisons in total.
- Display strings100%
- Fills99.7%
- Font style100%
- Alignment100%
- Merged cells100%
- KSA formats100%
| Criterion | openpyxl | LO Calc | .xls round trip | spec-minimal |
|---|---|---|---|---|
| Display strings | 100% | 100% | 100% | 100% |
| Fills | 99.7% | 99.7% | 100% | 100% |
| Font style | 100% | 100% | 100% | no data |
| Alignment | 100% | 100% | 100% | 100% |
| Merged cells | 100% | 100% | 100% | no data |
| KSA number formats | 100% | 100% | 100% | no data |
| Pixel similarityCoarse, informational only | 90.1% | 89.8% | 91% | 96% |
| Criterion | openpyxl | LO Calc | .xls round trip | spec-minimal |
|---|---|---|---|---|
| Display strings | 100 | 100 | 100 | 100 |
| Fills | 99.3 | 99.3 | 99.8 | 100 |
| Font style | 100 | 100 | 100 | not gated |
| Alignment | 100 | 100 | 100 | 100 |
| Merged cells | 100 | 100 | 100 | not gated |
| KSA number formats | 100 | 100 | 100 | not gated |
Five of the six dimensions are gated at 100, so a single regressed cell fails the run. Fills are gated lower because three cells differ by design, for the reason described below, and pinning the floor at 99.7 would make the gate fire on ordinary colour-scale rounding. The floor is 99.3% or better; the run scored 99.7%. Quote both, and never the floor alone as though it were the measurement.
On the spec-minimal fixture, three dimensions are not gated at all. LibreOffice renders none of the bold fonts or number formats its own styles.xml declares for that file, so there is nothing to compare against and the runner records the reason rather than scoring a fake 100%.
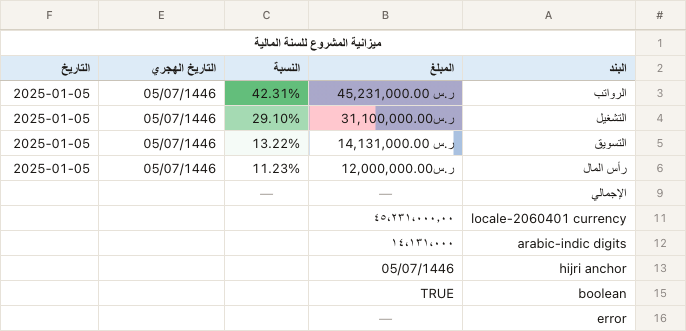
Three cells that differ by design
All three are colour-scale conditional formatting, and the difference is a privacy decision. Excel computes the minimum and maximum of a colour scale over every cell in the range, including hidden ones. The render model never ships a hidden cell's value to the browser, because the minimum of a range containing a hidden walkaway price would leak that price to anyone who read the gradient. The gradient is therefore computed over visible cells only, and three cells land on a slightly different shade.
Fidelity matters beyond appearance. A viewer that keeps the grid keeps the cell addresses, which is what makes a citation like Revenue!B14:F34 possible in the first place. Convert the workbook to a PDF and the addresses are gone, so the best a citation can do is name a page.
Related: Arabic, Hijri and RTL in data rooms · What a citation has to point at · Pricing
Every paid tier includes the viewer and the AI that cites it, with no per-page fees.